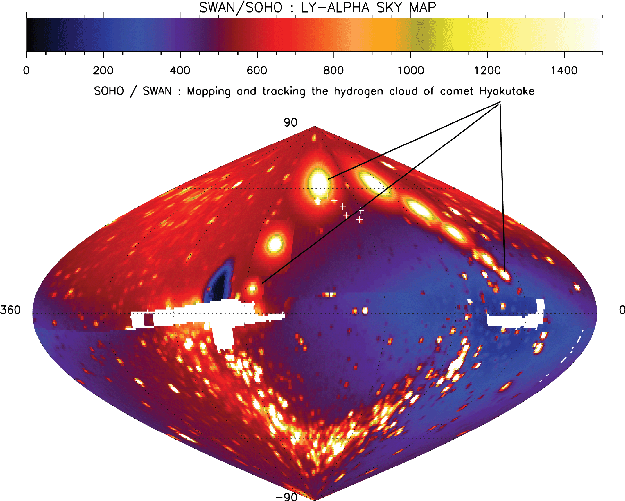
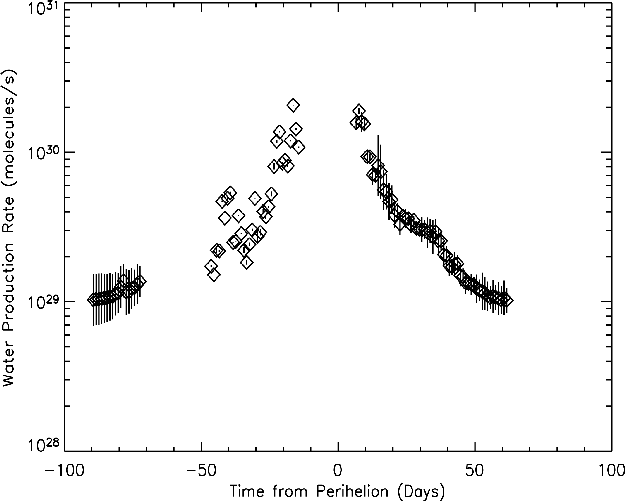
Comet 1996 B2 (Hyakutake) displayed strong evidence for break-up, with a prominent antisunward dust spike and fragments traveling antisunward for many days after an eruptive event in late March 1996. Because of its high orbital inclination and rapid southward motion after perihelion, its post-perihelion activity was not well monitored from the ground. The SWAN all-sky Lyman-alpha camera on the SOHO spacecraft was ideally placed for long-term monitoring of the hydrogen coma of comet Hyakutake both before and after perihelion. The SWAN images were analyzed with a new time-resolved model (TRM) that provides daily averages of the water production rate and an estimate of the hydrogen atom lifetime (dominated by charge exchange with solar wind protons) during extended periods throughout the apparition. A long-term variation of water production rate of 2.7 x 10^29 r^-2.1 +/- 0.08 molecules/s where r is the heliocentric distance in AU was found. The daily average values of the production rate covered the March 19 outburst and two more outbursts seen in the April before perihelion, which had progressively shorter durations at respectively smaller heliocentric distances. The long-term variation of the production rate was found to be consistent with the seasonal effect predicted by the jet rotation model of Schleicher and Woodney (2003, Icarus 162, 190-213) when added to a more steady source that is about two-thirds of the maximum of the jet source. The seasonal effect in their model found the dust jet source largely not illuminated after perihelion, coinciding with somewhat reduced overall activity and the absence of outbursts and fragmentation. The locations of the dust jets appear to be responsible for the outbursts and fragmentation before perihelion. The erratic behavior of the pre-perihelion jet sources as contrasted with the smoother variation from the rest of the surface after perihelion indicates there is a strong heterogeneity in the physical make-up of active areas on the nucleus.

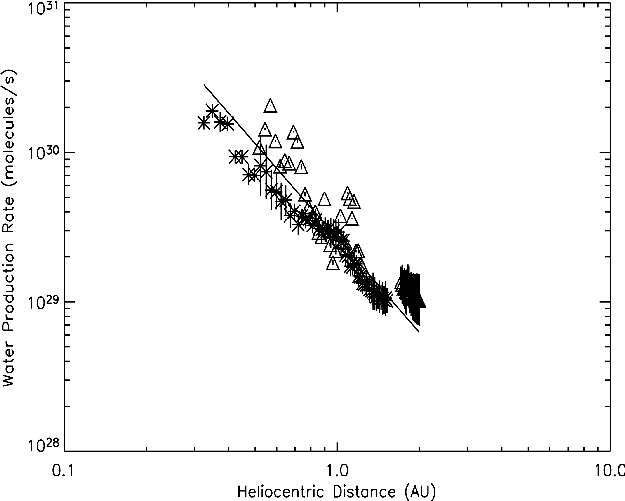
Shown are the extracted daily-average water production rates from the temporal deconvolution method where the hydrogen atom lifetime was fixed at the nominal value of 1.5 x 10^6 second. The solid line gives a simple power-law fit to the production rate proportional to r^-2.10 +/- 0.08. The pre-perihelion data are plotted as triangles and the post-perihelion data are plotted as asterisks. Except for the notable outburst activity before perihelion, the pre- and post- perihelion activity is quite similar.
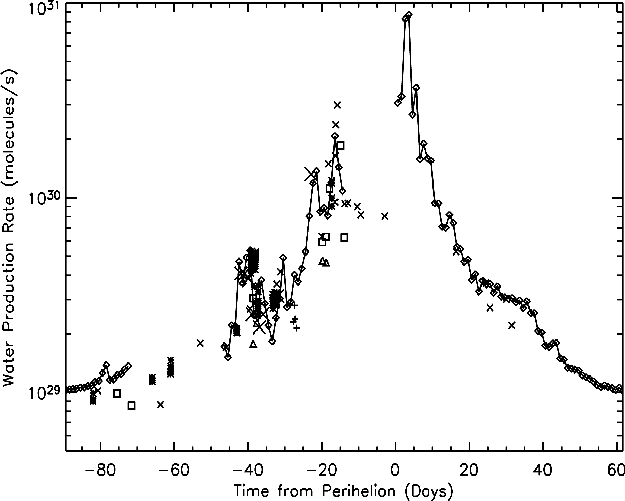
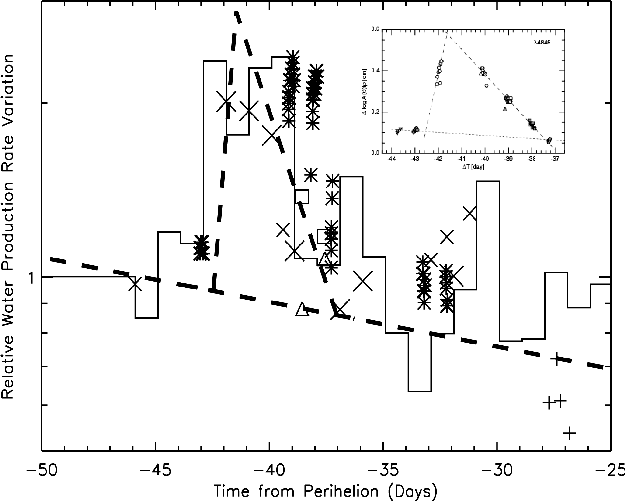
The daily-average SWAN water production rates are given by the small diamonds; those from 6300 Â O(1D) emission observations from Hicks and Fink (1997, Icarus 127, 307-318) are given as squares; those from ground-based OH observations from Schleicher and Osip (2001, Icarus 159, 210-233) are scaled by a factor of 2.5 and are given as asterisks; those from ground-based observations of water in the infrared by Dello Russo et al. (2002, J. Geophys. Res. 107, 5-1, CiteID 5095 DOI 10.1029/2001JE001838) are given as triangles; those from HST observations of OH and H Ly-a by Combi et al. (1998, Astrophys. J. 494, 816-821) are given as crosses. The scale factor brings the ground-based OH observations into rough agreement with SWAN, but it is noteworthy that this is comparable to differences seen before between ground-based OH observations using the A'Hearn et al. (1995, Icarus 118, 223-270) Haser model parameters and space-based observations (IUE and HST) using vectorial models or vectorial-equivalent average random walk Haser scale lengths. The observations of Dello Russo et al. explicitly adopted the outflow speed variation from Biver et al. (1999, Astron. J. 118, 1850-1872), which is consistent with the theoretical modeling here. We have therefore scaled the results of Hicks and Fink and Schleicher and Osip to have this variation. We did not, however, reanalyze their data to correct for the resulting variation of the scalelengths used in their modeling. The small x's are HCN production rates from Biver et al. (1999) scaled to water production rates using their factor of 1200, and the large x's are HCN production rates from Lis et al. (1997, Icarus 130, 355-372) scaled in the same way.
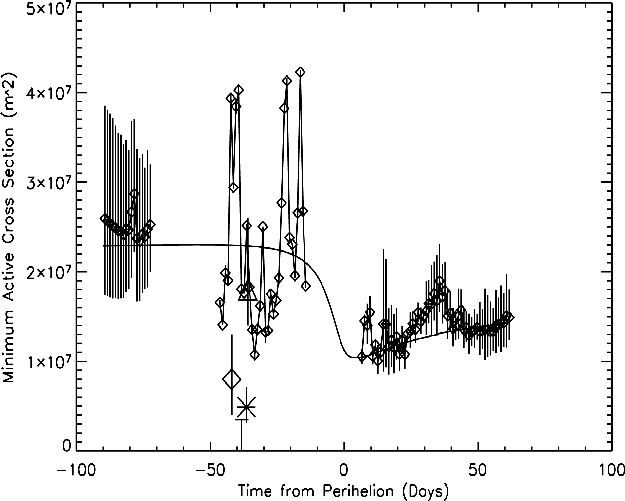
The SWAN water production rates were converted to minimum projected cross sectional areas using the method of Keller (1990, in "Physics and Chemistry of Comets," W.F. Huebner, ed., Springer-Verlag, Berlin, pp. 13-68) and expressed in Eq. 1 are given as the small diamonds with error bars and with contiguous groups of points connected with simple straight lines. The large triangle gives the nucleus cross section determined from the thermal IR measurements of Lisse et al. (1999, Icarus 140, 189-204). The large asterisk gives the nucleus cross section determined from the radar measurements of Harmon et al. (1997, Science 278, 1921-1924). The large diamond gives the nucleus cross section determined from the thermal IR measurements of Sarmecanic et al. (1997, Astrophys. J. 483, L69-L72) as calculated by Lisse et al. (1999). The upper limit bar just below the asterisk corresponds to the smallest upper limit of the cross section from the radio/interferometric observations by Altenhoff et al. (1999, Astron. Astrophys. 348, 1020-1034). The solid curve line is a production model using the dust-jet source nucleus rotation model of Schleicher and Woodney (2003, Icarus 162, 190-213) with a maximum of 56% of the production coming from the jet sources and 43% coming from the a uniform source.
The water production rates from SWAN (histogram) using the deconvolution method with a fixed H lifetime, are plotted as a function of time from perihelion. Also plotted are the other determinations as described in the caption to Figure 6. The initial peak of the outburst occurred on day 43 (19 March 1996). All the production rates are normalized to (detrended by) the power-law fit to the entire data set. Inset is the figure from Schleicher and Osip of their continuum filter observations at 4845 Â and from which they extrapolate the peak of the outburst on March 19.9. Their dashed-line heuristic representation has been transferred to the comparison plot with the rest of the data. It appears that despite the large SWAN aperture, the deconvolution method does account well for the time lag between the production rate outburst as water from nucleus and its response as H atoms in the coma. The outburst from the quasi-static analysis method alone is delayed by about 2 days and compressed in magnitude by about 25%.
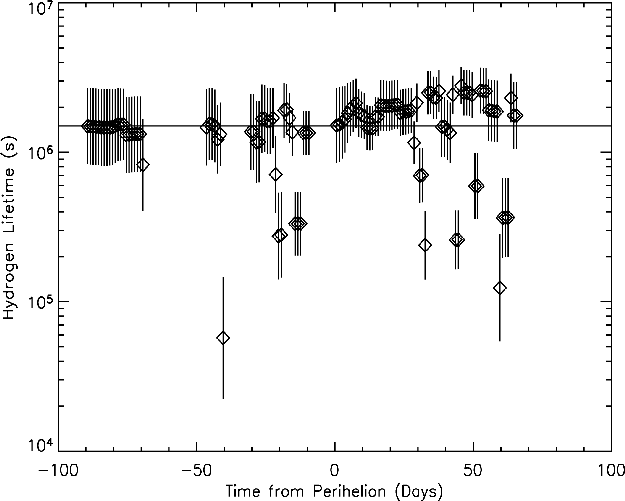
The lifetime of hydrogen atoms in the coma reduced to a heliocentric distance of 1 AU as extracted from the coma inversion process is plotted as a function of time in days from perihelion. The error bars plotted are 1-sigma. The lowest value, which is at -40 days from perihelion, is believed to be an artifact of the properties of the outburst in combination with the very small geocentric distance at that time. The line gives the average value of 1.5 x 10^6 s.
Click here for some neat SWAN pictures and movies.